Prostate Cancer Risk Calculators: PCPT vs PBCG vs ERSPC
Three prostate cancer risk calculators can give the same man a 3% risk and a 20% risk on the same afternoon. Here is what separates them, and which number I would actually act on.

Prostate cancer risk calculators are supposed to settle the argument. You enter your PSA, your age and your exam findings, and out comes a percentage that tells you whether a biopsy is worth having. The trouble is that the three most widely used models — PCPT, PBCG and ERSPC — can hand the same man numbers that disagree by a factor of six. In a Swedish screening study of 5,841 men, two of these calculators agreed on the biopsy recommendation in barely a third of cases. That is not a rounding error. It is the difference between going home and having twelve needles pass through your prostate. I have had men arrive in clinic with two printouts and a reasonable question: which one is right? This article answers that. For the wider picture, see the full Prostate Health Hub.
Key Takeaways
- The three calculators discriminate similarly — they rank men from low to high risk about equally well. What differs is the absolute percentage, and that is the number you are being asked to act on.
- In the Swedish STHLM3 cohort the median predicted risk of significant cancer was 3.3% using the Rotterdam model and 20% using PBCG, in the same men.
- PBCG was built on 16,369 biopsies performed between 2006 and 2017 and is calibrated to modern twelve-core practice. PCPT 2.0 is built on 1990s six-core biopsies and outdated grading.
- None of the original three include MRI. If you have already had a scan, a model that incorporates PI-RADS outperforms all of them.
- Always ask which endpoint your percentage refers to. A 12% risk of any cancer and a 12% risk of Gleason 7 or higher disease are different conversations.
What a Risk Calculator Does That a PSA Number Cannot
A PSA result on its own is mathematically thin. The same value of 4.8 ng/mL means something different in a 51-year-old with a firm area on examination than it does in a 72-year-old with a large, smooth, benign-feeling gland. A single cutoff cannot hold both of those men, which is why the old 4.0 ng/mL threshold has been quietly abandoned by everyone who works in this field. I have written separately about what a borderline result actually means in the grey zone between 4 and 10.
A risk calculator is a regression model. It takes several pieces of information that each independently shift the odds — age, PSA, the digital rectal exam finding, first-degree family history, ancestry, whether you have had a previous negative biopsy — and returns a probability. Some versions also take percent free PSA or prostate volume.
Two things about that output matter more than most patients are told. First, the models return two different endpoints: the risk of finding any cancer, and the risk of finding high-grade cancer, meaning Gleason 7 or above. The second number is the one that should drive the decision, because Gleason 6 disease found on a biopsy you did not need is the definition of overdiagnosis. Second, the percentage is only as good as the population the model was trained on — a point I will come back to, because it turns out to be the whole story.
The AUA and SUO Early Detection of Prostate Cancer guideline states that clinicians and patients may use validated risk calculators to inform shared decision-making about biopsy, graded as a conditional recommendation on Grade B evidence [5]. The word “may” is doing real work in that sentence. These are inputs to a conversation, not verdicts.
PCPT, PBCG and ERSPC: Three Tools, Three Different Eras
The oldest of the three is the Prostate Cancer Prevention Trial Risk Calculator. Its 2.0 version was built from 6,664 biopsies in the placebo arm of that trial and was the first widely used model to separate low-grade from high-grade disease and to allow percent free PSA as an input [2]. The problem is baked into its source data: those biopsies were performed in the 1990s using six cores and a grading system that has since been revised. Six-core sampling misses cancer that twelve-core sampling finds, which means the model was trained on a version of “negative biopsy” that no longer exists.
The PBCG risk calculator was built specifically to replace it. The Prostate Biopsy Collaborative Group gathered 16,369 biopsies performed in 15,611 men between 2006 and 2017 across eight North American institutions, then validated the model on more than 10,000 European biopsies [1]. Discrimination improved modestly — an area under the curve of 75.5% against 72.3% for PCPT — but calibration and clinical net benefit were substantially better. At a 10% risk threshold, using PBCG instead of PCPT would mean roughly 25 fewer biopsies per 1,000 men without missing a single high-grade cancer. The authors’ conclusion was blunt: use PBCG in place of the PCPT calculator.
The ERSPC risk calculator, better known in clinical use as the Rotterdam calculator, comes out of the European Randomized Study of Screening for Prostate Cancer [8]. Its distinguishing feature is that it asks for prostate volume, either measured on ultrasound or MRI or estimated on examination. That is a genuine advantage, because a PSA of 6 in a 30 mL gland and a PSA of 6 in a 90 mL gland are not the same finding. It also exists in a version that accepts a PI-RADS score.
| Calculator | Built from | What you enter | What it estimates |
|---|---|---|---|
| PCPT RC 2.0 (US, 2014) | 6,664 biopsies from the Prostate Cancer Prevention Trial placebo arm; 1990s, six-core sampling | Age, PSA, DRE, ancestry, family history, prior negative biopsy, optional percent free PSA | No cancer vs Gleason under 7 vs Gleason 7 or higher |
| PBCG RC (US and Europe, 2018) | 16,369 biopsies in 15,611 men, 2006-2017, eight North American centers, validated on three European | Age, PSA, DRE, African ancestry, first-degree family history, prior negative biopsy | Risk of high-grade (Gleason 7 or higher) cancer on biopsy |
| ERSPC / Rotterdam RC (Europe) | Rotterdam section of the European Randomized Study of Screening for Prostate Cancer | Age, PSA, DRE, prostate volume (measured or estimated), prior biopsy status | Any cancer and clinically significant cancer |
| MRI-ERSPC RC (Europe) | Same base model with imaging data added | All of the above plus the PI-RADS category from MRI | Any cancer and clinically significant cancer after imaging |
Before you agree to a prostate biopsy: the five numbers that actually change the decision
Enter your email below to receive Dr. Khalid’s complete PSA & Prostate Cancer Decision Guide as a free, printable PDF.
The Finding That Should Change How You Read Any Risk Percentage
In 2022 a Karolinska group ran both the Rotterdam and PBCG calculators across 5,841 men from the population-based STHLM3 screening study, of whom 1,054 (18%) turned out to have clinically significant cancer [3]. The results are the most useful thing published about these tools, and almost nobody explains them to patients.
The median predicted risk of significant cancer was 3.3% using Rotterdam and 20% using PBCG — in the same men, on the same day. Using Rotterdam’s own recommended action threshold of 4%, the two calculators produced the same biopsy recommendation in only 36% of men. At a 10% threshold they agreed in 23%.
Here is what makes that finding useful rather than merely alarming. Both models discriminated well: Rotterdam’s area under the curve was 0.74 and PBCG’s 0.70. Discrimination means the model ranks men correctly from lower to higher risk. Where they diverged was calibration — whether the actual percentage is right. PBCG’s calibration slope was 1.13, close to ideal in that cohort. Rotterdam’s was 0.73, meaning it systematically underestimated the risk of significant cancer. On decision-curve analysis PBCG delivered net clinical benefit at realistic thresholds while Rotterdam delivered none. When the researchers recalibrated both models to the local population, the disagreement largely vanished.
That last sentence is the mechanism. A calculator is tuned to the men it was built from. Move it to a population with different cancer prevalence, different referral patterns or different biopsy technique, and the ordering survives while the numbers drift. A screening cohort where 18% have significant cancer will not produce the same absolute risks as a referral clinic where 40% do.
In My Practice
A 61-year-old came to me last year with a PSA of 5.2, a normal examination and two printouts he had generated the night before. One said his risk of significant cancer was 6%. The other said 21%. He had spent the weekend deciding he probably had cancer, then deciding he probably did not, then deciding the whole exercise was worthless. What resolved it was not picking a winner between the two websites — it was getting an MRI, finding a 42 mL gland with a PI-RADS 3 lesion, and calculating a PSA density of 0.12. That figure, not either percentage, is what led us to hold off on biopsy and repeat his PSA in six months.
When two calculators disagree sharply, the disagreement itself is the signal: you are in the range where clinical variables alone cannot decide, and you need imaging rather than a better website.
Which Prostate Cancer Risk Calculators to Trust, and When
The honest answer is that the question is wrongly framed. There is no single most accurate model. There is a model that best matches your situation, and matching is what determines whether the number means anything.
- If you are in the US, have not had an MRI, and no prostate volume is available: PBCG is the reasonable default. It was built on contemporary North American biopsy practice, it includes prior negative biopsy and family history, and it was calibrated on twelve-core sampling.
- If a measured prostate volume is available: the Rotterdam model uses information the others discard, and volume is genuinely informative. Treat its absolute percentage with caution and its ranking with respect.
- If percent free PSA is the only extra data you have: PCPT 2.0 remains the model that accepts it. Use it knowing that the authors of its own successor recommended replacing it.
- If you have already had an MRI: none of the original three is the right tool. Skip to the imaging-inclusive models and the PSA density calculation.
If you want a starting point before any of that, our prostate cancer risk calculator weighs the same six clinical variables these models use and places you in a risk band rather than handing you a false-precision percentage. That is deliberate. A band tells you whether this warrants a formal calculation and an MRI. It does not pretend to be a validated probability, because a browser-based tool should not.
Ancestry and MRI: The Two Things the Original Three Miss
The calculator that performs better overall may perform worse for you
A Chicago group compared PBCG and PCPT 2.0 in 954 men undergoing first biopsy across five hospitals, of whom 48.5% were Black [4]. Discrimination did not differ significantly between the two calculators in any racial group. Calibration did. PBCG overpredicted risk at most thresholds in Black men and in men of other minority backgrounds, while its improvements over PCPT were clear in white men. At a 30% action threshold, PCPT would have avoided biopsy in 68% of these patients against PBCG’s 28%, with broadly similar rates of missed significant cancer (23% versus 20%).
The authors’ conclusion was that PCPT may lead to better biopsy decisions in racial minority groups. That is an uncomfortable finding, and it sits awkwardly beside the broader evidence favoring PBCG. It is also a reminder that “African ancestry, yes or no” is a crude variable standing in for a mixture of genetics, access to care and referral patterns. If you are a Black man being given a PBCG percentage, it is fair to ask your urologist whether that number may be running high.
Imaging changes the arithmetic entirely
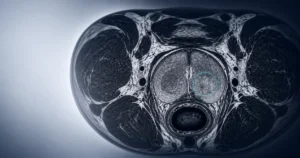
All three original calculators predate routine pre-biopsy MRI, and none of them accept a PI-RADS score. In 392 men who had multiparametric MRI before transperineal biopsy, the MRI-inclusive ERSPC model reached an area under the curve of 0.803 for significant cancer, against 0.745 for the standard ERSPC model and 0.746 for PBCG [6]. That is not a marginal gain. It is the difference between a model that guesses at what the scan would have shown and one that knows.
Practically, this means the sequencing matters as much as the model. Use a clinical calculator to decide whether MRI is justified. Once the scan exists, let the PI-RADS category and PSA density carry the biopsy decision. I have set out how that sequence works in MRI before biopsy, and when it changes the plan.
How to Use a Risk Number in the Room With Your Urologist
If someone gives you a percentage, four questions convert it from a number into information. Ask them in this order.
- Which calculator produced this? If the answer is vague, the number is not usable. PCPT, PBCG, Rotterdam and the MRI versions are not interchangeable.
- Is this the risk of any cancer, or of Gleason 7 or higher? Ask for the high-grade figure specifically. That is the number that should decide whether needles are worth it.
- What risk threshold do you act on, and why that one? Many clinicians act somewhere near 10% for significant disease. Knowing the threshold tells you how close to the line you are.
- Was this run before or after my MRI? A pre-MRI number that has not been updated after imaging is out of date the moment the scan is reported.
One further point on inputs. The AUA guideline advises confirming a newly elevated PSA with a repeat test before ordering a secondary biomarker, imaging or biopsy, because a proportion of elevations normalize on their own [7]. If your risk percentage was calculated from a single unconfirmed PSA taken during a UTI, after a long cycle ride or within days of ejaculation, ask for the PSA to be repeated in four to six weeks and the calculation redone. Prostate testing also sits inside a wider set of decisions for men over 40, which I have mapped out in the 40-plus men’s health checklist.
When a Calculator Should Not Be the Deciding Factor
Risk models are built for men with a modestly elevated PSA and no other alarming findings. Several presentations move past them entirely and need urgent urological assessment rather than a probability:
- A hard nodule or asymmetric firm area felt on digital rectal examination, whatever the PSA
- A PSA above 50 ng/mL with no infection and no recent prostate instrumentation — at that level the AUA guideline notes that biopsy may even be omitted in favor of proceeding to treatment
- New bone pain, particularly in the back, hips or ribs, alongside a raised PSA
- Visible blood in the urine, or blood clots, at any PSA level
- A PSA that has risen sharply between two properly taken samples rather than drifting
In any of these situations, ask for a urology referral within two weeks rather than recalculating a percentage.
Frequently Asked Questions
Which prostate cancer risk calculator is the most accurate?
No single one wins everywhere. In a Swedish screening cohort the PBCG calculator was well calibrated while the Rotterdam model underestimated significant cancer. In a US multi-ethnic cohort, PBCG overpredicted risk in Black men. Accuracy depends on how closely the source population matches you. If an MRI has already been done, ask for a PSA density figure instead — our PSA density calculator shows why that number often decides it.
Can I use a prostate cancer risk calculator before my first PSA test?
No. Every model discussed here takes a PSA value as its main input, so there is nothing to calculate without one. What you can decide before testing is whether screening is appropriate for your age and family history. Our age-by-age prostate cancer screening guide sets out when the AUA suggests starting and how often to repeat.
My calculator says 12% risk. Does that mean I should have a biopsy?
It depends on which endpoint that 12% refers to and what threshold your urologist acts on. Many clinicians act somewhere near 10% for Gleason 7 or higher disease, but a 12% risk of any cancer is a very different situation from a 12% risk of aggressive cancer. Ask which one it is before agreeing. If you do proceed, what a prostate biopsy actually feels like is worth reading first.
Why did two websites give me completely different prostate cancer risk numbers?
Because they were built on different men. Each model is tuned to the biopsy technique, cancer prevalence and grading system of its source cohort, so identical inputs produce different outputs. Ranking men from low to high risk is something all three do similarly well. The absolute percentage is what drifts, sometimes by a factor of six, and recalibrating the models to a local population largely closes the gap.
Do risk calculators still matter now that MRI is routine?
They matter more, but the older ones need replacing. None of the original three include imaging, and a model incorporating PI-RADS outperformed both ERSPC and PBCG for significant cancer in men scanned before biopsy. Use a clinical model to decide whether MRI is warranted, then let the scan and PSA density drive the biopsy decision.
References
- Ankerst DP, Straubinger J, Selig K, et al. A contemporary prostate biopsy risk calculator based on multiple heterogeneous cohorts. Eur Urol. 2018;74(2):197-203. doi:10.1016/j.eururo.2018.05.003. PubMed
- Ankerst DP, Hoefler J, Bock S, et al. Prostate Cancer Prevention Trial risk calculator 2.0 for the prediction of low- vs high-grade prostate cancer. Urology. 2014;83(6):1362-1367. doi:10.1016/j.urology.2014.02.035. PubMed
- Chandra Engel J, Palsdottir T, Ankerst D, et al. External validation of the Prostate Biopsy Collaborative Group Risk Calculator and the Rotterdam Prostate Cancer Risk Calculator in a Swedish population-based screening cohort. Eur Urol Open Sci. 2022;41:1-7. doi:10.1016/j.euros.2022.04.010. PubMed
- Carbunaru S, Nettey OS, Gogana P, et al. A comparative effectiveness analysis of the PBCG vs PCPT risk calculators in a multi-ethnic cohort. BMC Urol. 2019;19(1):121. doi:10.1186/s12894-019-0553-6. PubMed
- Wei JT, Barocas D, Carlsson S, et al. Early detection of prostate cancer: AUA/SUO guideline part I: prostate cancer screening. J Urol. 2023;210(1):46-53. doi:10.1097/JU.0000000000003491. PubMed
- Wei G, Kelly BD, Timm B, et al. Clash of the calculators: external validation of prostate cancer risk calculators in men undergoing mpMRI and transperineal biopsy. BJUI Compass. 2021;2(3):194-201. doi:10.1002/bco2.58. PubMed
- American Urological Association / Society of Urologic Oncology. Early Detection of Prostate Cancer Guideline (2023; amended 2026). AUA
- SWOP – The Prostate Cancer Research Foundation. The Rotterdam / ERSPC prostate cancer risk calculators. SWOP
Dr. Muhammad Khalid
MBBS · FCPS (Urology) · MCPS (General Surgery) · CHPE · CRSM · IMC #539472
Specialist urologist with 11+ years of clinical experience across tertiary teaching hospitals. Trained at Lady Reading Hospital and Khyber Teaching Hospital, Peshawar. Author or co-author of five peer-reviewed international publications, including in Cureus and the World Journal of Surgery. Procedural expertise: URS, PCNL, RIRS, TURP, TURBT, and major open urological surgery. Full profile →
This article is for educational purposes only and does not constitute medical advice. Always consult your physician or urologist for diagnosis and treatment decisions specific to your condition.