
Vascular Age Calculator
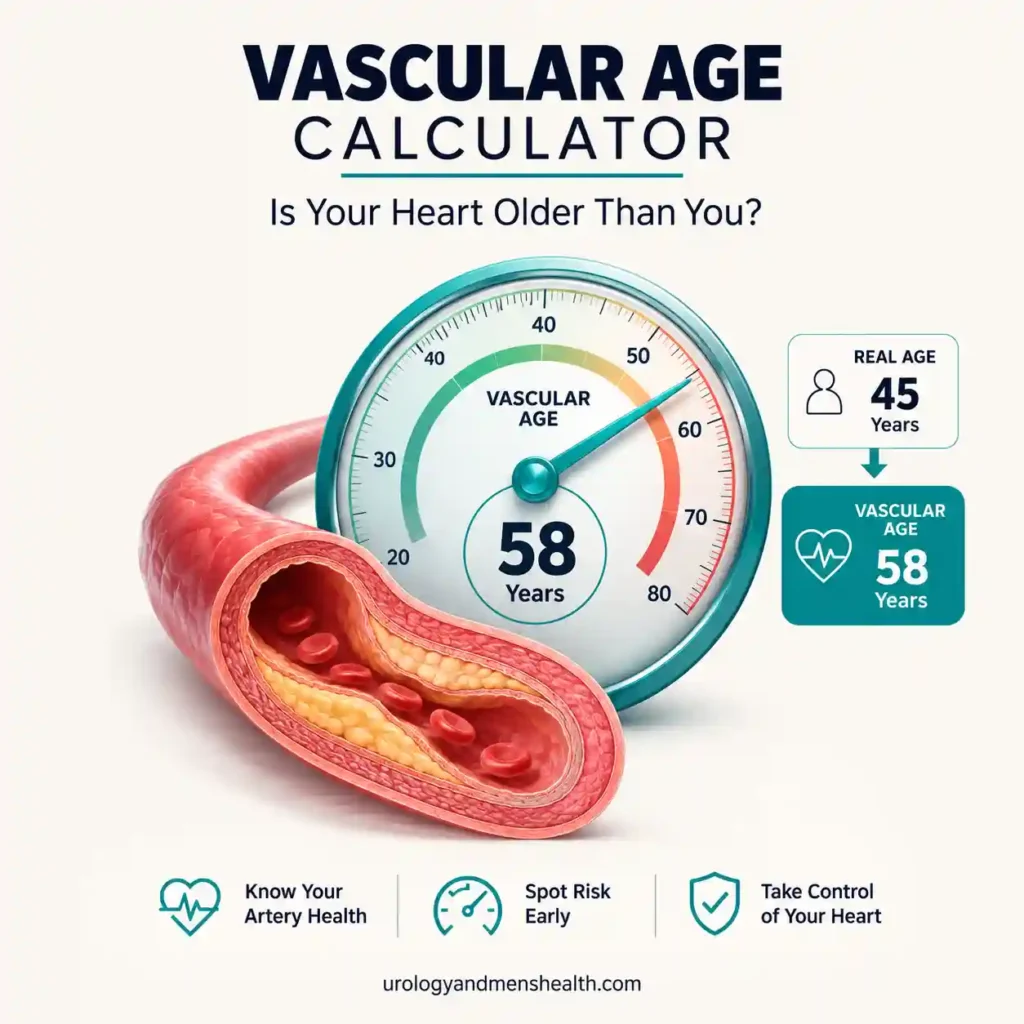
This vascular age calculator turns your blood pressure, cholesterol, and a few health facts into a single number: the age your arteries are behaving like. It runs the 2023 AHA PREVENT equations, the race-free model that replaced the older Framingham and Pooled Cohort math, then translates your 10-year cardiovascular risk into a vascular age you can picture. See where you stand and what moves the number in the blood pressure hub.

The Tool
Related Blood Pressure Tools
Full Clinical Guide
In This Guide:
- Vascular age converts your AHA PREVENT 10-year cardiovascular risk into a single, easier-to-picture number.
- It uses blood pressure, cholesterol, smoking, diabetes, and kidney function — the same inputs your doctor already tracks.
- A vascular age ahead of your real age is usually driven by one or two numbers, and both are treatable.
- The percentage is the validated science; the age is the translation — recalculate after any change to watch it move.
What This Tool Measures
This vascular age calculator does not invent a new score. It runs the 2023 AHA PREVENT equations — the American Heart Association’s sex-specific, race-free models for predicting cardiovascular disease, developed by Sadiya Khan and colleagues from data on more than six million people across 46 datasets [1]. PREVENT estimates your 10-year and 30-year risk of total cardiovascular disease — heart attack, stroke, and heart failure combined — for adults aged 30 to 79. This tool takes that validated 10-year risk and translates it into a single vascular age: the age at which a person with ideal risk factors would carry the same risk you do. The percentage is the science; the vascular age is the plain-language version. You can read how PREVENT reshaped risk scoring in the 2025 hypertension and PREVENT guide.
The Physiology Behind the Score
Think of your arteries as pipework. Every year they carry blood under pressure, and every year a little wear accumulates — faster when the pressure is high, when cholesterol deposits build, when blood sugar runs high, or when tobacco smoke inflames the lining. Vascular age asks how worn the pipework is, expressed in years rather than percentages. Two things drive it. The first is what you cannot change: your age and sex. The second is what you can: systolic blood pressure (the top number), non-HDL cholesterol (total minus HDL), diabetes, current smoking, and kidney function measured as eGFR. Which of those is doing the most damage decides the plan — a vascular age driven mainly by blood pressure points to a different first move than one driven by cholesterol, and both differ again from one driven by smoking. That is why the tool asks for each input separately rather than lumping them into one figure.
How to Interpret Your Result
Two 50-year-old men sit in my clinic. One reads a vascular age of 50; the other, a smoker whose blood pressure runs 148/92 mmHg, reads 68. Same birthday, an 18-year gap in how their arteries behave, and completely different advice. That gap is the number to watch. If your vascular age sits at or near your real age, your risk factors are in the expected range and the job is maintenance. If it runs a few years ahead, one or two numbers are usually the cause and both are fixable. If it runs well ahead — or your 10-year risk is high in absolute terms, which matters more as you get older — several factors are stacking together, and this is exactly where treatment does the most good. In the model’s own worked example, adding smoking to an otherwise identical 50-year-old raised her 10-year risk from 5.4% to 9.3% [1].
What to Do With Your Result
The value of a vascular age is that it points at a lever. If blood pressure is the driver, the first moves are a home blood pressure log, less sodium, and possibly an antihypertensive. If non-HDL cholesterol is the driver, the conversation is about diet and whether a statin fits your 10-year and 30-year risk. If body weight or glucose sits underneath both, the BMI and metabolic syndrome screen helps untangle which. Whatever the driver, the plan has the same shape: pick the one or two numbers with the most room to move, act, and recalculate in 3 to 6 months so you can watch the vascular age fall. If you are unsure about your result, the PDF report this tool generates gives you a ready-made framework to bring to your next appointment.
In My Practice
A percentage rarely changes behavior. I have watched the same patient shrug at “your 10-year risk is 12 percent” and then go quiet at “your arteries are running eight years ahead of you.” The equation does the same maths either way, but the second version is one a person can feel — and feeling it is usually what starts the conversation about the statin they had been putting off.
Vascular age earns its place not because it is more accurate than the risk percentage — it comes from the same equation — but because it is far easier to act on.
References
- Khan SS, Matsushita K, Sang Y, et al. Development and Validation of the American Heart Association’s PREVENT Equations. Circulation. 2024;149(6):430-449. Circulation. Derivation and validation study for the equations used by this tool.
- Khan SS, Coresh J, Pencina MJ, et al. Novel Prediction Equations for Absolute Risk Assessment of Total Cardiovascular Disease Incorporating Cardiovascular-Kidney-Metabolic Health: A Scientific Statement From the American Heart Association. Circulation. 2023;148(24):1982-2004. PubMed. AHA statement setting out the rationale for PREVENT.
- Arnett DK, Blumenthal RS, Albert MA, et al. 2019 ACC/AHA Guideline on the Primary Prevention of Cardiovascular Disease. Circulation. 2019;140(11):e596-e646. Circulation. Framework for risk-based primary prevention.
- Visseren FLJ, Mach F, Smulders YM, et al. 2021 ESC Guidelines on cardiovascular disease prevention in clinical practice. Eur Heart J. 2021;42(34):3227-3337. PubMed. European counterpart using risk-factor-based CVD risk.
Frequently Asked Questions
What does a vascular age actually tell me?
It tells you the age at which a person with ideal risk factors would carry the same 10-year cardiovascular risk you do. If you are 50 and your vascular age reads 60, your combined heart-attack, stroke, and heart-failure risk resembles that of an average-risk 60-year-old. It is the same validated PREVENT percentage, shown as an age so it is easier to picture and act on.
My blood pressure changes through the day – which reading do I use?
Use a recent, resting reading, seated with your feet flat after a few minutes of quiet, not one taken right after climbing stairs or during stress. If your readings bounce around, an average of several home measurements is more honest than a single clinic figure. Our guide on how to read your blood pressure numbers explains which reading counts and why the top number drives this calculation.
How often should I recalculate my vascular age?
Recalculate whenever an input changes, a new lipid panel, a lower blood pressure, quitting smoking, or weight loss, and otherwise once a year. The point of a vascular age is to watch it move, so re-running it 3 to 6 months after starting a change shows whether that change is working. Logging your readings with the blood pressure log and trend tracker between calculations makes the trend clearer.
How accurate is this tool, and can I rely on it?
This tool runs the published AHA PREVENT equations, the same model used in clinical practice, and reproduces the values from the original study. But it is a screening and education aid, not a diagnosis: it cannot see your family history, coronary calcium score, or other risk-enhancing factors. Treat the result as a well-grounded starting point for a conversation with your doctor, not a final verdict.
How do I use this result at my doctor’s appointment?
Bring the numbers, not just the vascular age. Use the Download My Report button to generate a one-page PDF with your inputs, your 10-year and 30-year PREVENT risk, and a short list of questions to ask. It gives your doctor the exact figures to check and a starting point for deciding whether lifestyle change, a statin, or blood pressure treatment fits your risk.
Dr. Muhammad Khalid
MBBS · FCPS (Urology) · MCPS (General Surgery) · CHPE · CRSM · IMC #539472
Specialist urologist with 11+ years of clinical experience across tertiary teaching hospitals. Trained at Lady Reading Hospital and Khyber Teaching Hospital, Peshawar. Author or co-author of five peer-reviewed international publications, including in Cureus and the World Journal of Surgery. Procedural expertise: URS, PCNL, RIRS, TURP, TURBT, and major open urological surgery. Full profile →
This article is for educational purposes only and does not constitute medical advice. Always consult your physician or urologist for diagnosis and treatment decisions specific to your condition.