
Blood Pressure Log & Trend Tracker
This blood pressure log turns a week of home readings into one clear number and the exact AHA/ACC category it falls into - normal, elevated, stage 1, or stage 2. Enter your morning and evening averages, add your last clinic reading if you have one, and see whether a white-coat or masked gap is hiding your real risk. Start from the blood pressure hub for the full picture.

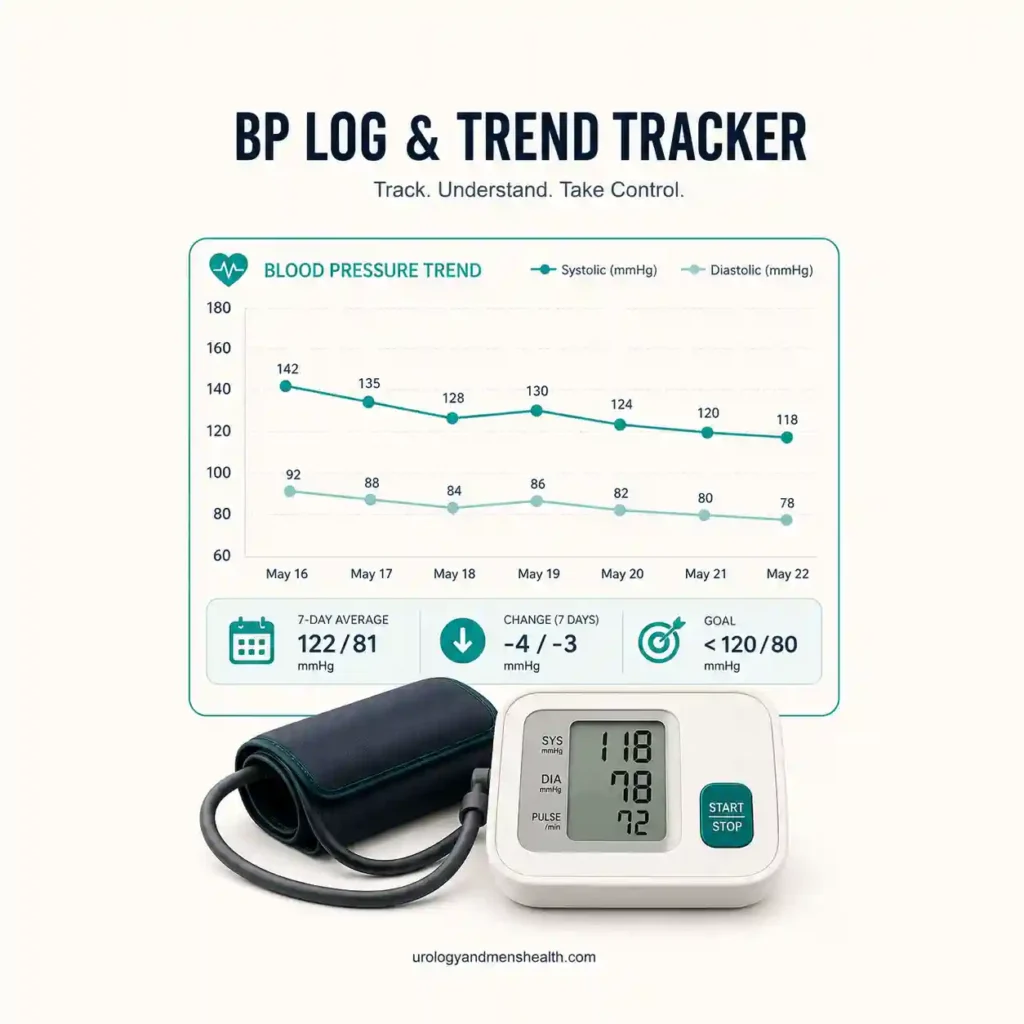
The Tool
Related BP Tools
Full Clinical Guide
In This Guide:
- A week of home readings beats any single clinic check – the 7-day average is the number that predicts your risk.
- AHA/ACC bands: under 120/80 is normal, 130/80 and up is hypertension, over 180/120 is a crisis.
- Compare clinic and home to catch white-coat (falsely high in clinic) and masked (falsely reassuring in clinic) patterns.
- Stage 1 is decided by your overall cardiovascular risk, not the reading alone.
What This Blood Pressure Log Measures
This blood pressure log takes a week of your own home readings, turns them into a single average, and places that average in the category system used by the 2025 AHA/ACC High Blood Pressure guideline [1]: normal, elevated, stage 1, or stage 2 hypertension. It works this way because one reading — especially one taken in a clinic — is a poor guide to your true pressure. The guideline now treats out-of-office measurement as the most reliable way to diagnose and follow high blood pressure. The recognized method is the “722” schedule: two readings each time, morning and evening, for seven days, with the first day’s numbers usually set aside [4]. This tool assumes you have measured that way and are entering your averages.
How Blood Pressure Categories Work
Blood pressure is written as two numbers: systolic — the top number, the pressure as your heart pushes blood out — over diastolic, the pressure between beats. The AHA/ACC thresholds are stacked: an average below 120/80 mmHg is normal; 120–129 systolic with a diastolic under 80 is elevated; 130–139 or 80–89 is stage 1; and 140/90 or above is stage 2. Any reading above 180/120 mmHg is a hypertensive crisis [3]. Picture the arteries as garden hoses: the higher the standing pressure, the more the walls stiffen and the harder the heart and kidneys work, year after year. That slow strain — not any single high day — is what ages your vessels, which you can estimate with the Vascular Age Calculator. Europe’s 2024 ESC guideline draws its hypertension line higher, at 140/90 [2]; this tool follows the AHA/ACC numbers.
How to Read Your Result
Read your result as a band, not a bullseye. A home average of 118/76 mmHg and one of 152/94 mmHg describe two very different men: the first needs only to keep doing what he is doing; the second needs a prompt plan and, most likely, medication. In between, a stage 1 average of, say, 134/84 mmHg is the band where your wider risk decides the next move rather than the reading itself. If you entered a clinic number too, watch the gap: high in clinic but normal at home is the white-coat pattern, while normal in clinic but high at home is masked hypertension — the more dangerous of the two, because it hides real risk behind a reassuring office visit. And because high pressure is the single largest driver of kidney damage, a raised average is never only a heart issue.
What to Do With Your Numbers
What you do next depends on the band. A normal or elevated average means holding the line: the DASH eating pattern, regular activity, and a real cut in sodium are the levers that keep numbers from drifting. A stage 1 average means asking your doctor for your PREVENT risk estimate, because that decides whether lifestyle alone or lifestyle plus a tablet is right; low-risk stage 1 usually earns a genuine three-to-six-month lifestyle trial first [1]. A stage 2 average usually means starting medication now, and a confirmed crisis reading means same-day care. Because raised pressure quietly scars the kidneys, it is worth checking that link directly with the BP & Kidney Damage Risk Tool. Whatever your band, bring numbers, not impressions, to your appointment. If you are unsure about your result, the PDF report this tool generates gives you a ready-made framework to bring to your next appointment.
In My Practice
The most useful thing a man ever hands me is a folded sheet of home readings. When I can see a fortnight of numbers, I can tell in seconds whether a worrying clinic reading is his real pressure or just the waiting room talking — and I have started medication, held off medication, and changed doses on the strength of that sheet more often than on any single reading taken in front of me.
A printed home log does not replace your doctor; it hands your doctor the one thing a clinic visit cannot give — your pressure on an ordinary day.
References
- 2025 AHA/ACC/Multisociety High Blood Pressure Guideline (Guideline-at-a-Glance). Journal of the American College of Cardiology. BP categories, 3-6 month lifestyle window, PREVENT risk threshold.
- McEvoy JW, et al. 2024 ESC Guidelines for the management of elevated blood pressure and hypertension. European Heart Journal. European classification (hypertension at 140/90).
- Understanding Blood Pressure Readings. American Heart Association. Category chart and the 180/120 crisis threshold.
- Standardized home blood pressure monitoring: rationale behind the 722 protocol. PMC. Two readings, twice daily, seven days; first-day readings discarded.
- Reducing home BP monitoring days for detecting hypertension. Hypertension. High home BP defined as systolic 130 or diastolic 80; 7-day averaging.
Frequently Asked Questions
Should I use my home readings or my clinic reading for this tool?
How many days of readings do I need before this is reliable?
My home numbers are lower than my clinic numbers. Which is right?
How accurate is this tool, and can I rely on it?
How do I use this result at my doctor’s appointment?
Dr. Muhammad Khalid
MBBS · FCPS (Urology) · MCPS (General Surgery) · CHPE · CRSM · IMC #539472
Specialist urologist with 11+ years of clinical experience across tertiary teaching hospitals. Trained at Lady Reading Hospital and Khyber Teaching Hospital, Peshawar. Author or co-author of five peer-reviewed international publications, including in Cureus and the World Journal of Surgery. Procedural expertise: URS, PCNL, RIRS, TURP, TURBT, and major open urological surgery. Full profile →
This article is for educational purposes only and does not constitute medical advice. Always consult your physician or urologist for diagnosis and treatment decisions specific to your condition.